- Economy Insights
- Posts
- Mobile Data Usage
Mobile Data Usage
How Much Internet Do We Use Monthly?

Mobile connectivity has become truly ubiquitous. Today about 5.78 billion people (≈70.5% of the world’s population) use a mobile phone, and roughly 87% of those handsets are smartphones. As networks have expanded, mobile data use has surged: GSMA reports that average monthly data per user grew from 8.4 GB in 2021 to 11.3 GB in 2022. By late 2024 this explosive growth had continued – global cellular traffic reached ~157 EB per month, and each smartphone averaged ~21.6 GB/month. In short, mobile data now underpins daily life more than ever, driving everything from video streaming and social media to remote work and IoT.
Global Average Data Consumption Per User
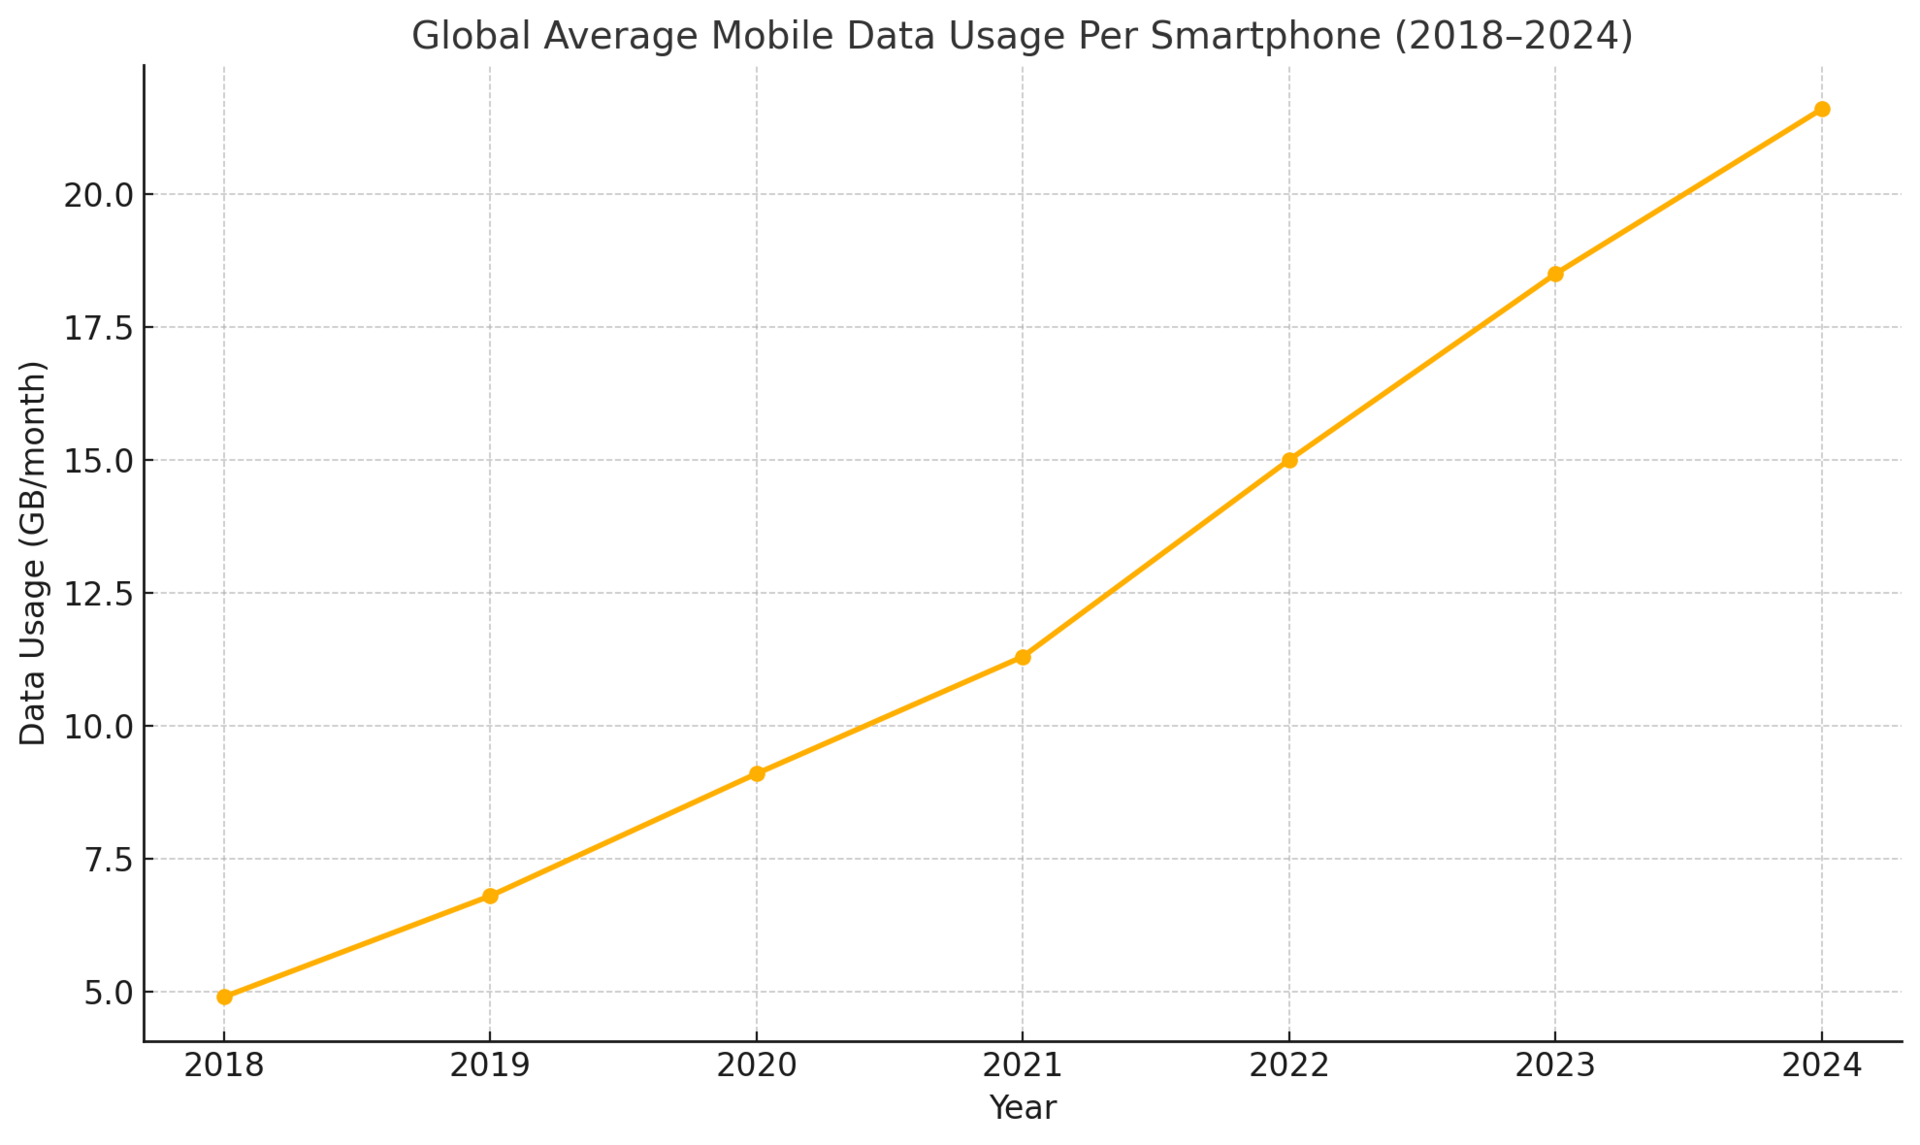
Smartphone data use is rising rapidly. Ericsson’s latest analyses project that by end-2024 the typical smartphone will consume ~21 GB of data per month, nearly four times the 2018 level. Similarly, DataReportal finds that average cellular data per device grew from ~4.9 GB in Q3 2018 to ~21.6 GB by Q3 2024. Thus, in just six years monthly usage has roughly quadrupled. (By comparison, GSMA found global per-user usage of only 11.3 GB in 2022, underscoring how fast growth has been accelerating.) Globally, data traffic has exploded: from about 21.8 exabytes/month in 2018 to 157 EB/month in 2024. This chart (DataReportal) illustrates the surge:

This chart illustrates the global average monthly mobile data usage per smartphone user from 2018 to 2024. Based on data from Ericsson Mobility Reports and DataReportal, it shows a steady and steep increase in data consumption—from 4.9 GB/month in 2018 to an estimated 21.6 GB/month in 2024. This growth reflects broader adoption of high-speed networks (4G/5G), higher-resolution video content, and increased mobile app usage.
Users in different markets consume very different amounts of data. For example, Ericsson reports that in 2024 India/Nepal/Bhutan lead the world at about 32 GB per smartphone per month, whereas Sub-Saharan Africa averages only ~5 GB. Western Europe and North America average around 20–22 GB each, reflecting richer networks and content.
Breakdown by Activity Type
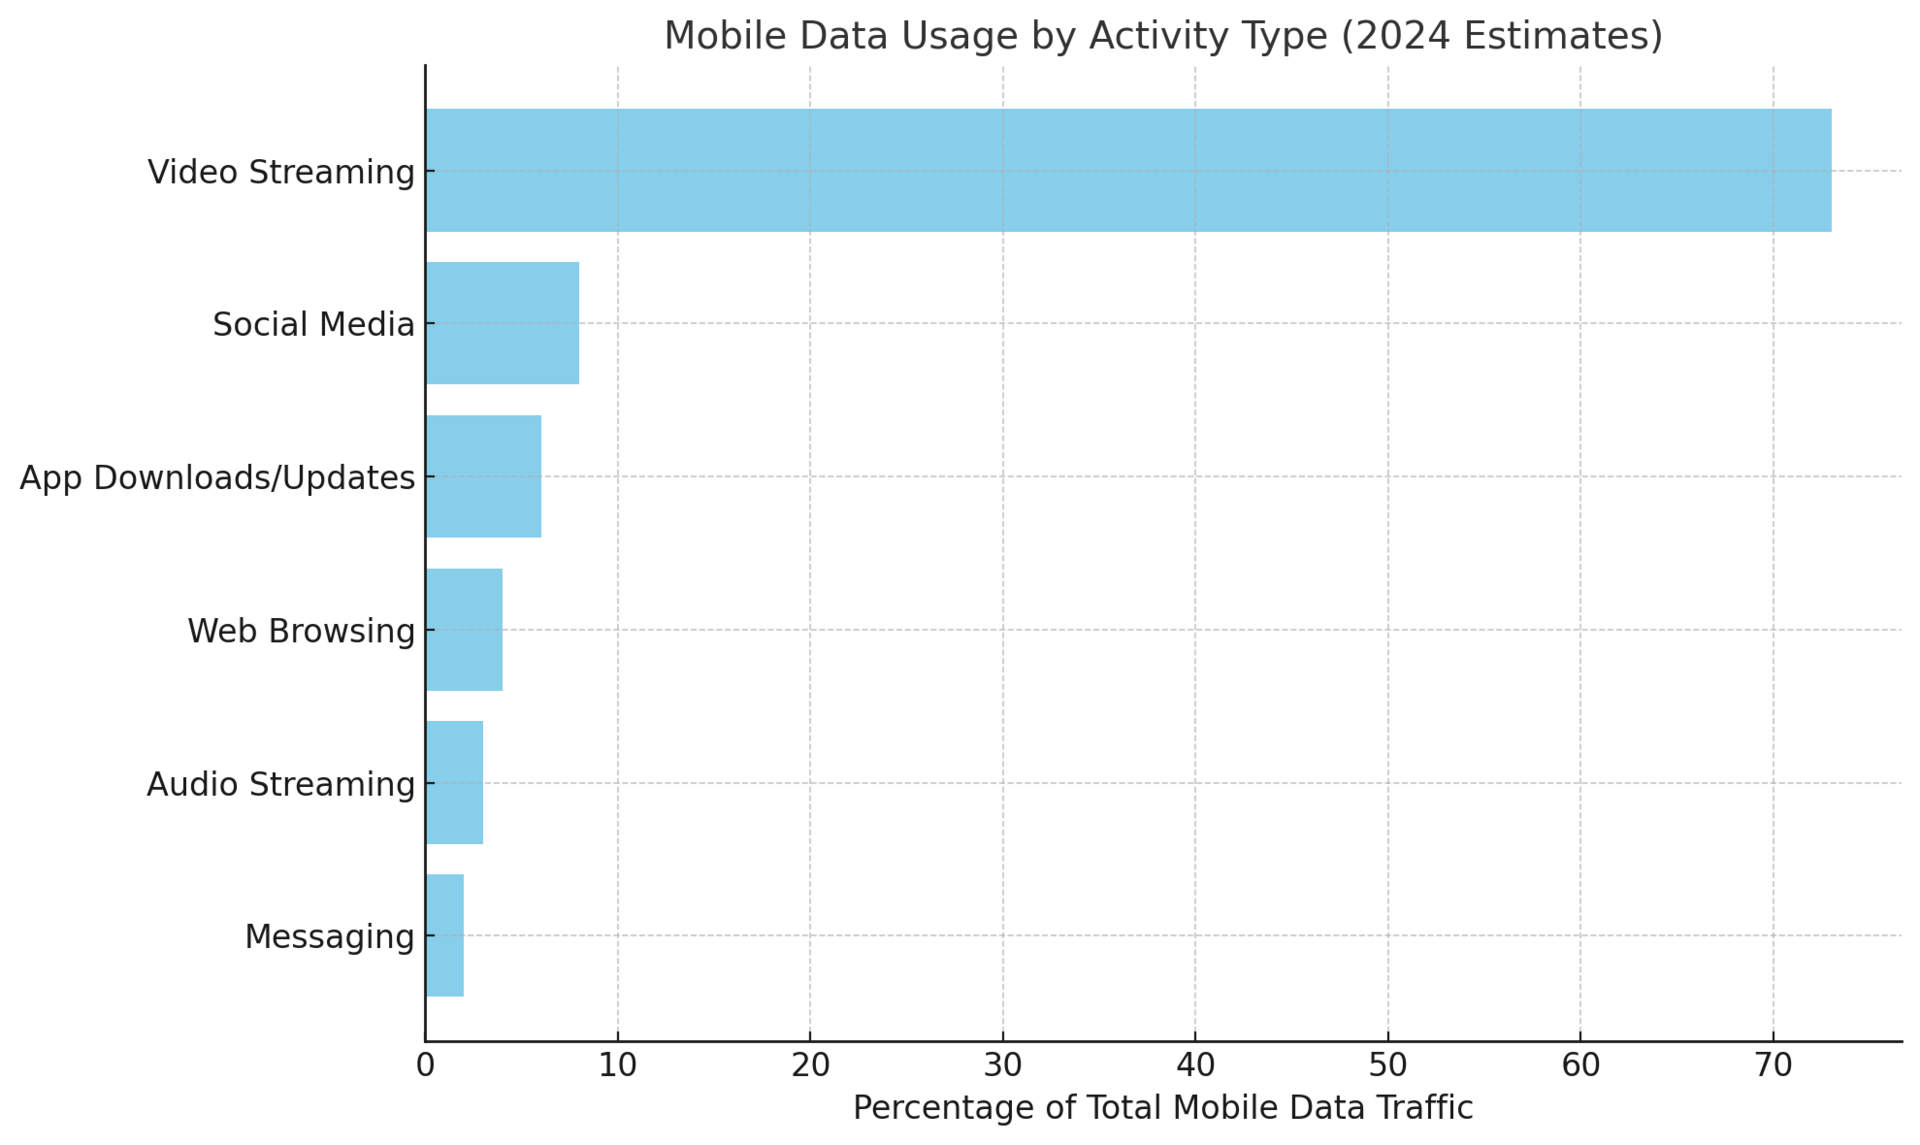
Not all data is created equal: video streaming dominates mobile usage. Around 60% of smartphone data is video today, rising to ~74% by 2024. In other words, roughly three-quarters of all mobile traffic is video (YouTube, Netflix, TikTok etc.). By contrast, social networking, web browsing, and other categories each account for far smaller shares. For instance, DataReportal figures show social apps use only about 7.8% of traffic (~11.5 EB/month), while generic web browsing is only ~1–2%.

This horizontal bar chart displays the estimated percentage breakdown of global mobile data usage by activity type in 2024. According to Ericsson and DataReportal, video streaming dominates, accounting for 73% of all mobile data traffic. Social media follows with 8%, while app downloads/updates, web browsing, audio streaming, and messaging make up the rest. This visualization highlights how disproportionately video content drives global data consumption on smartphones.
Ericsson’s breakdown of average per-user data confirms video’s dominance: by end-2024 a typical smartphone spent ~16.3 GB/month on video streaming, versus only ~0.9 GB on messaging, ~2.1 GB on general app downloads, and ~0.4 GB on audio streaming. This means video alone accounted for roughly three times all other traffic combined. (Other categories such as file downloads, online gaming, and system updates consume even smaller volumes.) The chart above (DataReportal/Meltwater) visualizes this breakdown: video is by far the largest slice, followed by social networking, software updates, web browsing, audio streaming and the rest.
Demographic Trends in Data Consumption
Usage also varies by who you are and where you live. Regional differences: Users in Asia (especially South Asia) and the Middle East tend to use more data than those in Africa. For example, as noted above India/Nepal/Bhutan are at ~32 GB/user-month, versus only ~5 GB in sub-Saharan Africa. Wealthier markets with extensive 4G/5G infrastructure (Europe, North America, Gulf States) generally see higher per-user usage (20–29 GB) than lower-income regions.
Age: Younger people use far more mobile data than older adults. GSMA Intelligence notes that younger age groups have consistently shown higher uptake of digital services than older cohorts. In practice, this means teens and 20-somethings binge more video/social content on mobile, whereas users over 50 tend to use data more modestly. The result is a “digital divide” by age: as 6–10 hours online per day is common for young adults, older generations often spend much less.
Gender and urban/rural: Globally, women still lag men in mobile internet use. GSMA reports that in many countries women are significantly less likely to use mobile internet than men, due to barriers like affordability and awareness. A similar gap exists for rural vs. urban residents: rural users (and often women in those areas) are less likely to be connected. In some developing countries, smartphone penetration and data use are substantially lower among female and rural populations. (These gaps are slowly narrowing but remain significant in many regions.)
Historical Evolution of Mobile Data Usage
Mobile data demand has grown exponentially over the past decade. Early 2010s traffic was doubling yearly, a trend Ericsson predicted would continue through 2018. In fact, global mobile data traffic did roughly 10-fold between 2011 and 2016. In the smartphone era, this growth has persisted: per-user usage rose from under 1–2 GB/month in 2013 to about 5–6 GB/month by 2018. Since then, it has surged even more. For example, as noted above, average per-user usage went from 4.9 GB in 2018 to ~21 GB in 2024.
This rapid growth reflects both network upgrades and richer content. The switch from 3G to 4G (and now 5G) has enabled much faster speeds, encouraging more video and app use. Early forecasts proved prescient: an Ericsson report in 2012 warned mobile data was doubling every year, driven largely by video. In reality, usage growth did stay very high through the 2010s. Over the last 5–10 years, improvements in latency and capacity (4G → 5G) have let users stream HD video, play online games, and use cloud services from their phones, driving the trajectory shown above.
Future Projections and 5G/6G
Mobile data demand is expected to keep rising, though at a moderated pace. For example, Ericsson’s latest Mobility Report forecasts that global monthly mobile data traffic (excluding fixed wireless access) will grow from ~120 EB in 2024 to roughly 280 EB by 2030. This implies an average annual growth on the order of 10–12%. By 2030, 5G networks are projected to carry about 80% of all mobile data traffic (up from ~35% at end-2024), reflecting 5G’s rapid rollout and use in high-bandwidth applications like 4K video, AR/VR and industrial IoT.
Looking even further ahead, 6G research (for the 2030s) envisions ultra-high speeds (studies suggest 6G systems could one day deliver on the order of 100 Gb/s per user). Such speeds could support holographic media, full-immersion VR, and massive IoT connectivity. However, it’s unclear if users will need all that bandwidth. Some analysts observe that consumer data-rate demand may begin to plateau – for most users, streaming and browsing needs might top out below 1 Gb/s. In other words, new applications (e.g. mixed reality, AI-assisted services) will be key to justifying ever-greater capacity.
In summary, most forecasters expect continued growth through 2030, driven by richer content and more devices. But there is debate: some ITU-based forecasts have even imagined zettabyte-scale traffic by 2030, while others (like Ericsson) predict a few hundred exabytes. The exact trajectory will depend on how quickly technologies (AR/VR, telepresence, connected cars) take off and whether data-efficiency measures slow demand.
Environmental Impact of Mobile Data
The explosion of data has a non-negligible environmental footprint. Transferring data requires energy. For example, GSMA estimates that a mobile network uses on average ~0.13 kWh of electricity per GB of data. Given current volumes, this adds up: smartphone video alone (~111 EB/month) demands on the order of 14.4 billion kWh per month to transmit. (By way of perspective, that is several times the monthly electricity consumption of a city like London.)
In aggregate, data centers and transmission networks consume a few percent of global power. The IEA notes that all data centers and networks combined were responsible for roughly 1% of energy-related CO₂ emissions (with recent efficiency improvements modestly offsetting demand growth). Mobile-specific networks are part of this. As 5G and future 6G roll out, operators are investing in more energy-efficient equipment (massive MIMO, AI-driven optimization, renewable energy sourcing, etc.).
For consumers, this means our data habits have a hidden cost. High-definition streaming, for instance, uses far more data (and hence energy) than audio or text, so choosing lower resolutions or downloading when on Wi-Fi can reduce impact. The industry also emphasizes network “greening” (e.g. sleep modes for idle towers). Nonetheless, it’s clear that the continued surge in mobile data pushes up electricity and associated emissions unless countered by efficiency gains and cleaner power sources.
Tips for Managing and Reducing Mobile Data Usage
For users on limited plans, small changes can make a big difference. Some practical strategies include:
Use Wi-Fi whenever possible: Connect to trusted Wi-Fi (home, work, or public hotspots) to offload heavy traffic. Disable “Wi-Fi Assist” or “Smart Network Switch” features that automatically fall back to cellular when Wi-Fi is weak.
Monitor and cap usage: Check your phone’s built-in data counter or carrier app, and set warnings or hard limits in Settings. For example, Android and iOS both allow data warnings/auto shutoff at a set threshold.
Lower streaming quality: Video is data-hungry. Streaming in standard rather than HD resolution (or downloading content in advance) can cut usage by 50–90%. Similarly, choose lower-quality options for music or video apps, and turn off auto-play of videos in social media feeds.
Limit background data: In your phone’s settings disable background app refresh or restrict individual apps (e.g. social apps, cloud backup) from using cellular data when not active. Also disable automatic app updates or only allow them on Wi-Fi.
Use “Lite” apps and data-saving modes: Many services (Facebook, YouTube, Google Maps, etc.) offer data saver modes or lite versions that compress content. Enable these modes to reduce data load.
Download for offline use: When on Wi-Fi, pre-download maps, podcasts, videos or music for offline access. Navigation apps like Google Maps let you save maps, and many streaming apps allow offline downloads.
By combining these practices—staying on Wi-Fi, cutting video quality, and curbing background data—users can dramatically slow their data consumption and avoid overage charges.